Edda Viviana Forero Triana and Juan Pablo Garnica Munévar. May 16, 2022.
Datasketch implemented the Sucre Information System and Cultural Map: mapaculturaldesucre.com. The platform is an interactive initiative to showcase the heritage and artistic practices of this Colombian department. This project took two years and included more than 600 people in identifying Sucre’s cultural goods and services. On Friday, May 13, was its launch.
The Platform Process
The information system results from collaborative work between the Datasketch teams, ACUA Foundation (Afro Cultural Assets), and the public sector. The dialogue between experts, cultural managers, citizens, and institutional actors and the documentation of primary and secondary sources of information provided the basis for the system and the map.

Source: ACUA Foundation.
Datasketch offers database structuring services for information systems and visualizations through applications and interactive dashboards from functional and interactive design. In addition, it has APPS to provide data science tools at people’s fingertips.
In this project, the Culture and Research and Structuring Teams of Datasketch systematized the data collected by the ACUA Foundation.
The Design Team worked on the visual aspects of the portal based on the results of the design thinking workshops we held with the Governor’s Office of Sucre, the Mixed Fund for the Promotion of Culture and the Arts of Sucre and the different stakeholders of the project. The Technology and Data Team made the application of visualizations and integrated the data to implement the web page.

Design thinking workshop board for Sucre Cultural Map.
The Tools in Detail
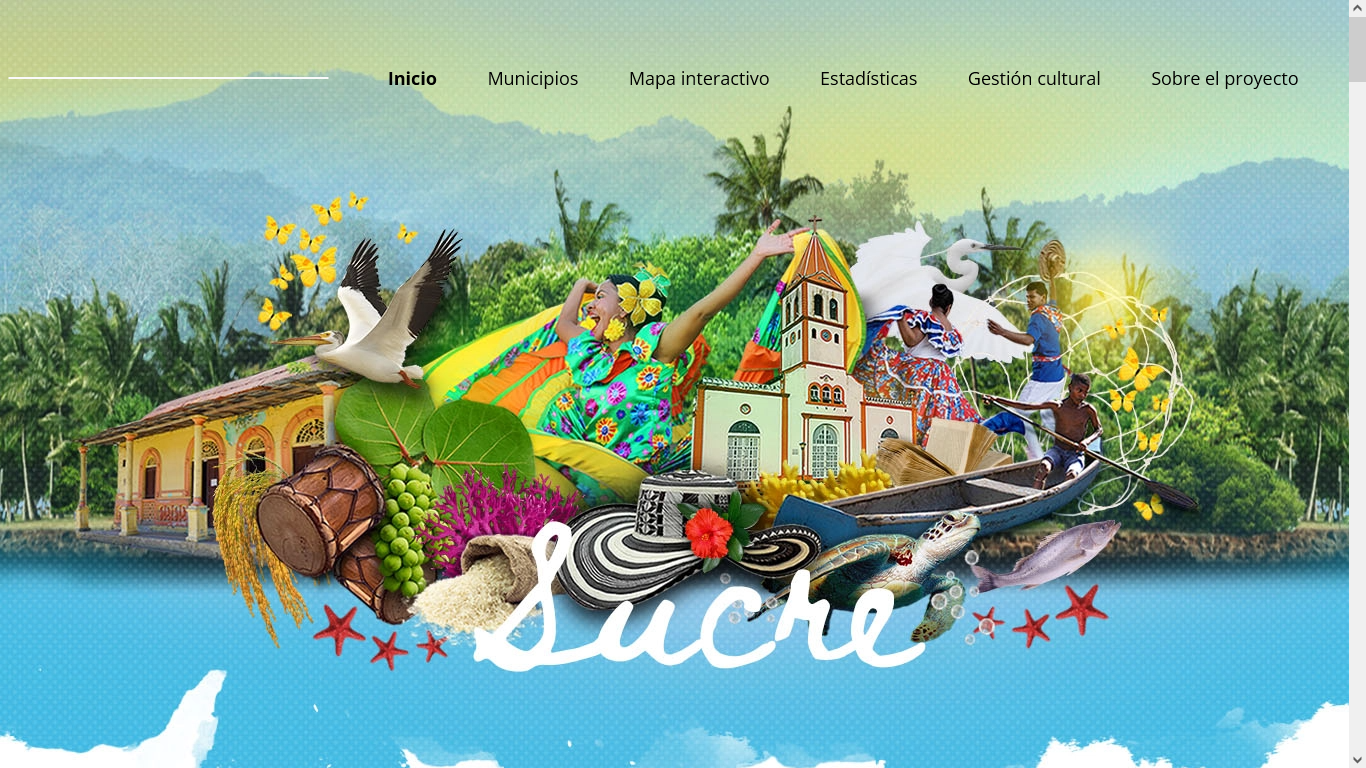
The home page introduces Sucre and its cultural richness through text and a map. When scrolling down, it refers to the other tool sections that make up the website: Municipalities, Interactive Map, Statistics, Cultural Management, and About the Project.

Source: Interactive Map | Sucre
“Municipalities” has information on their artistic expressions, sociodemographic data, cultural and institutional management, cultural heritage, photo gallery, and the option to download the cultural profile of each one.
The “Interactive Map” brings together the records of all the municipalities to present data on artistic and heritage expressions in an interface that promotes exploration. The option “This is how Sucre sounds”, which shows representative rhythms of the department, stands out.
The “Statistics” section leads to the visualization tool, which displays data according to certain filters, several ways to visualize them (bar chart, choropleth map, treemap, or table) and encourages interaction with the “Detail” option. The visualizations are downloadable in different formats, such as CSV (comma-separated values), XLSX (Excel file), and JSON (Javascript object notation), in the case of tables.
“Cultural management” focuses on organizations linked to cultural practice and management in the department. Filters by region, municipality, and type of organization facilitate the search. Finally, “About the project” describes the platform, its implementation, and those who participated in it.
The Cultural Map of Sucre tools are aimed at cultural managers, institutional actors, cultural practitioners, artists and experts, academia, and the general public. The information system will enable the democratization of knowledge, the critical review of sociocultural realities by contrasting information, and decision-making.
This project is a product of the territorial impact strategy to strengthen the cultural system of the five subregions of Sucre (La Mojana, Golfo del Morrosquillo, Sabanas, San Jorge and Montes de María). Through data science, we visualize the creative vocation of the twenty-six municipalities that make up the department and promote access to open data to safeguard artistic practices and natural and cultural heritage.
