Data Visualization: Scatter Plot (or Correlation Chart)
In the world of data visualization, there are charts that stand out for their simplicity and, at the same time, their ability to reveal complex patterns. The scatter plot is one of them. At first glance, it may seem like a disordered set of dots, but when read carefully, it allows us to identify relationships, trends, and behaviors that are not evident in a table.
What is a scatter plot?
A scatter plot is a type of chart that displays the relationship between two numerical variables, representing each data pair as a point on a Cartesian plane (X and Y axes). By observing how these points are distributed, it is possible to detect if there is any type of relationship between the two variables, whether positive, negative, or nonexistent.
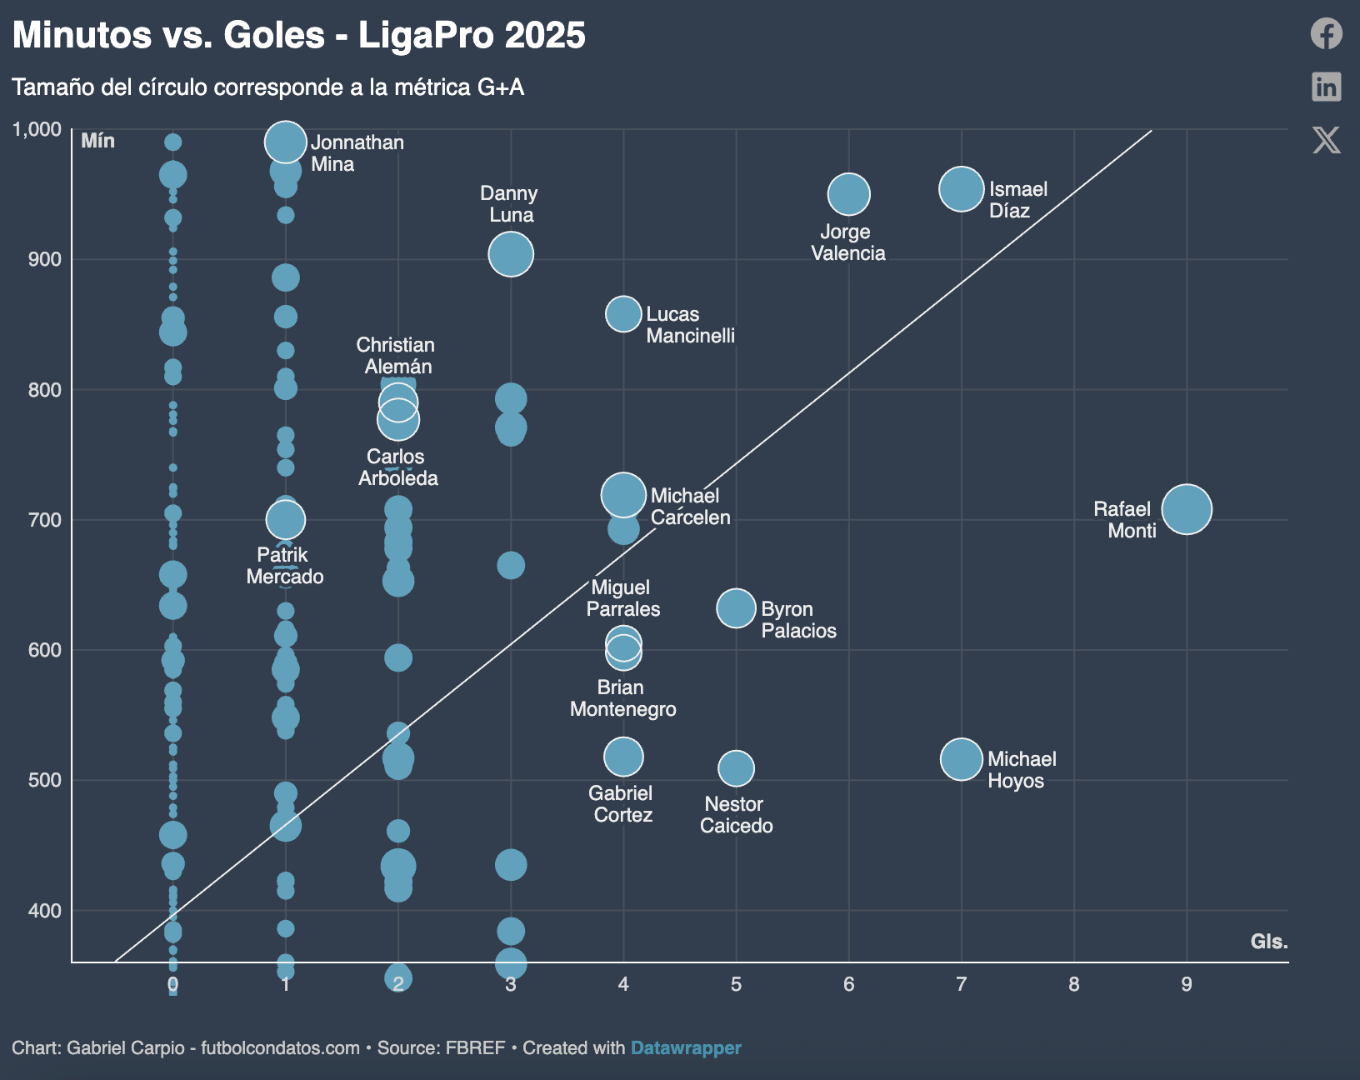
Chart taken from the portal Fútbol con datos.
What is it used for?
This type of visualization is used primarily to explore relationships between variables and formulate hypotheses. For example, it can help answer questions such as whether a higher income level corresponds to a higher educational level, or if there is a relationship between the number of hours worked and productivity. It is also useful for identifying outliers—points that deviate from the general behavior—and for evaluating whether a relationship appears linear or follows another type of pattern.
In data journalism and public analysis, scatter plots allow for contrasting rhetoric with evidence. They do not prove causality on their own, but they do offer a visual basis for discussing correlations and opening new lines of analysis.
Recommendations
For a scatter plot to be clear and useful, it is important to choose the variables well. Both must be numerical and comparable. It is also advisable to clearly label the axes and, when necessary, include units of measurement. If the chart contains many points, it can be useful to adjust the transparency to avoid visual clutter. In some cases, adding a trend line helps guide the reading, but this should always be done carefully, explaining what it represents.
Another key aspect is context. An isolated scatter plot can lead to hasty interpretations, so it is fundamental to accompany it with an explanation that clarifies what is being compared and why.
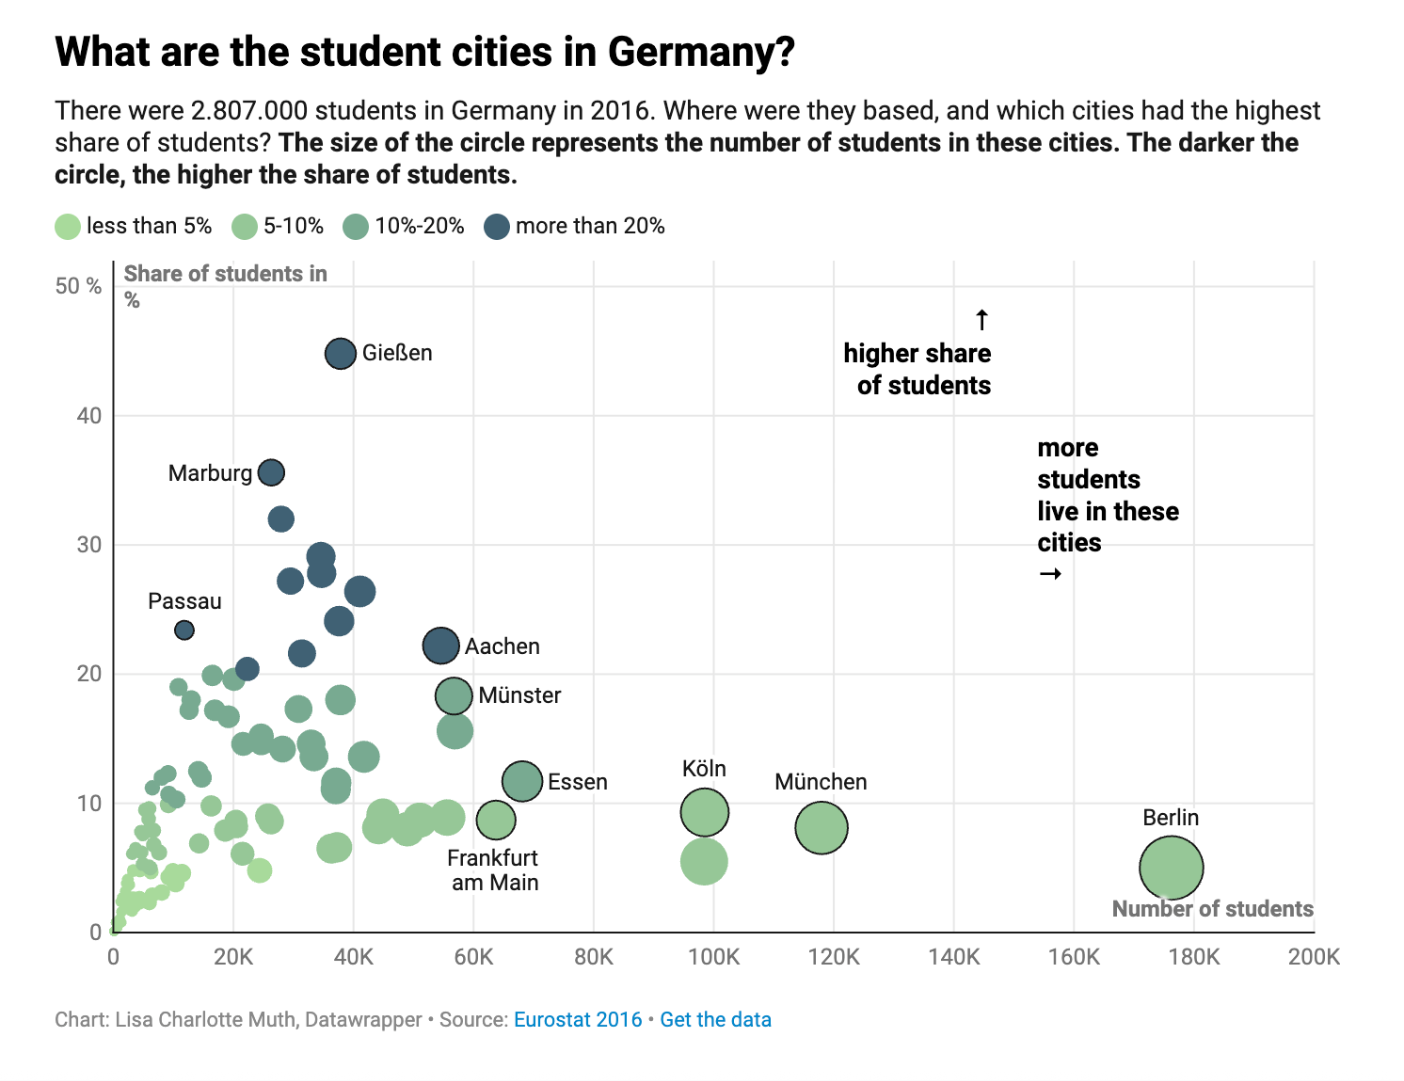
Chart taken from the Datawrapper website.
Related Visualizations
There are other charts that complement or expand the analysis offered by a scatter plot. Bubble charts, for example, incorporate a third variable through the size of the points. Density plots allow for a better understanding of the concentration of observations when there is a lot of data. It is also common to combine scatter plots with small multiples to compare patterns across different groups.
Examples
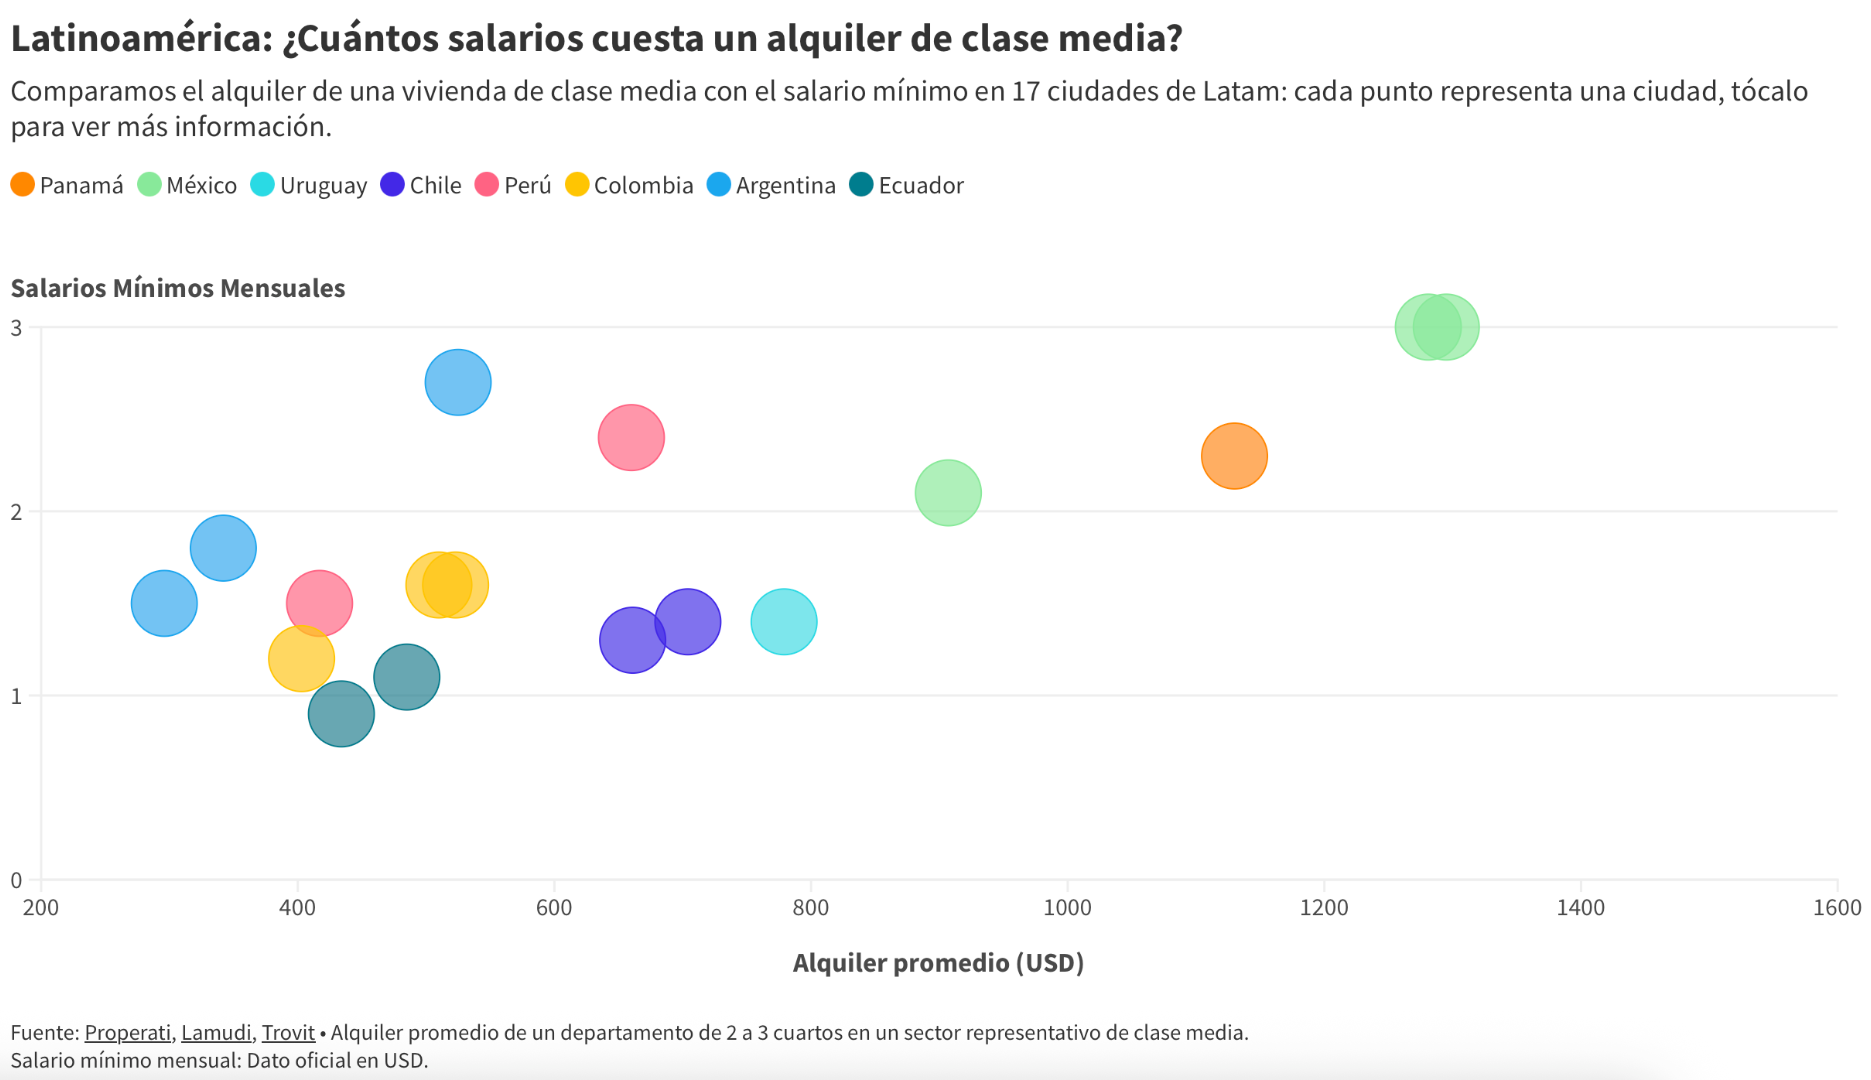
This chart created by Properati compares the average rent of a middle-class home with the monthly minimum wage in 17 Latin American cities. Each point represents a city: the horizontal axis shows the average cost of rent in dollars, and the vertical axis shows how many minimum wages are needed to pay for it.
The combined reading of both axes allows us to understand not only how much it costs to rent, but how affordable that cost is for those receiving the minimum wage in each urban context
Create your Datasketch account and start visualizing this and other types of charts.
