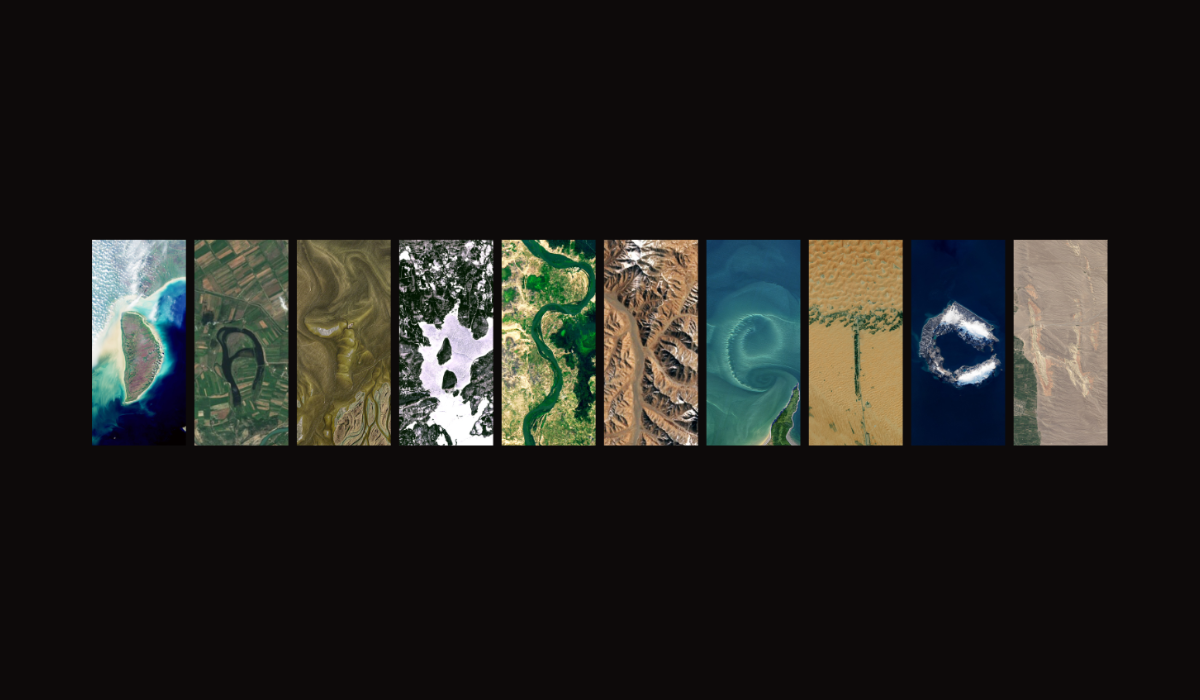
Datasketch written with different satellite images
Satellite imagery is a powerful tool with countless applications, from environmental monitoring to urban planning. In this blog, we’ll break down the key concepts, explore major data sources, and review the tools you need to start using satellite images effectively across different areas of analysis.
Interested in accessing and visualizing data? Register at Datasketch today!
What is a Satellite Image? An Introduction to the Electromagnetic Spectrum
A satellite image is a visual representation of the Earth’s surface captured from space by satellites. Unlike traditional photographs, these images not only capture what we can see with the naked eye, but also collect data through different wavelengths of light that are part of the electromagnetic spectrum.
This spectrum includes all types of light, from visible light, which we can see, to other forms of light that we cannot perceive, such as infrared or ultraviolet. Each type of light, or “spectral band,” corresponds to a specific part of the spectrum and reveals different details about the Earth’s surface. For example:
- Visible Bands: Capture light visible to the human eye (blue: 0.45-0.51 µm, green: 0.53-0.59 µm, red: 0.64-0.67 µm).
- Near-Infrared Bands (0.85-0.88 µm): Especially useful for analyzing vegetation.
- Short-Wave Infrared Bands (1.57-1.65 µm): Help detect moisture content.
- Thermal Bands: Measure heat emissions.
By combining these different bands, satellite images can reveal a variety of features. For example, combining near-infrared, red, and green bands creates a “false color composite” that highlights vegetation in bright red, helping analysts monitor the condition of forests or agricultural productivity.
Key Components of Satellite Imagery
When working with satellite images, it’s crucial to understand certain factors that determine both the data quality and the type of analysis you can perform. These characteristics, called resolutions, depend on the satellite capturing the image and are essential for deciding which images to use.
- Spatial resolution: indicates how detailed the image is. Basically, it refers to the size of the smallest object you can see. For example, a spatial resolution of 1 meter means you can identify objects of that size or larger.
- Spectral resolution: Determines the number and width of spectral bands that the satellite can capture in the image. The more bands it has, the more information about the Earth’s surface you can obtain, which will allow you to perform more detailed analysis.
- Temporal resolution: indicates how often a satellite passes over the same location. If you need to track rapid changes, such as in agriculture or disaster monitoring, a satellite with high temporal resolution will be key.
- Radiometric resolution: refers to the ability to detect small differences in light intensity. In other words, it indicates how many levels of gray or colors an image can capture. The higher the radiometric resolution, the more subtle and precise the variations that can be observed.
Depending on the specific goal of the analysis, certain characteristics may be prioritized over others. For instance, to monitor crop growth, high spectral resolution is prioritized to detect changes in vegetation, while for urban studies, high spatial resolution may be essential to identify fine details in structures.
Types of Satellites and their Data
Satellites are devices that orbit Earth and collect valuable data about our planet. Different types of satellites exist depending on the information they can capture. Optical satellites work like cameras, taking images of the surface using reflected light, both in the visible and infrared spectrum. In contrast, radar satellites emit microwave signals and analyze their bounce back, allowing them to obtain data about the Earth’s surface even in cloudy conditions or during the night.
Satellite missions like Landsat, Sentinel, and WorldView offer different resolutions and data types. Landsat is ideal for long-term monitoring, Sentinel combines optical and radar data for detailed analysis, and WorldView, with its high resolution, is perfect for urban planning. Understanding the mission helps choose the appropriate images based on the type of analysis you need.
Top 4 sources for satellite imagery
NASA Earth Data
NASA’s Earth Data platform stands as one of the most comprehensive collections of Earth science data available to the public. The platform hosts data from multiple satellite missions, including Terra and Aqua MODIS satellites that provide daily global coverage. These satellites capture crucial information about Earth’s atmosphere, land surface, and oceans. NASA Earth Data requires free registration and offers multiple download formats including GeoTIFF, NetCDF, and HDF5. The platform particularly excels in climate research and global environmental monitoring, with extensive documentation supporting users in accessing and processing data.
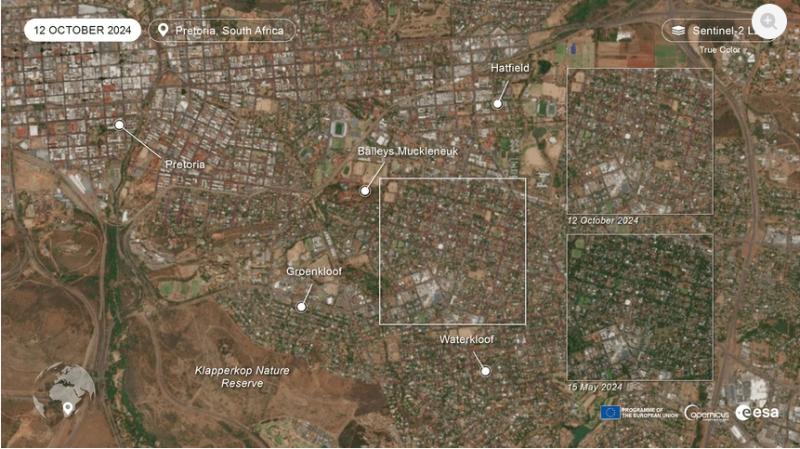
ESA Copernicus Open Access Hub
The Copernicus program, driven by the European Space Agency (ESA), aims to provide essential data and services for Earth observation, focusing on the environment and crisis management. Within this program, the Sentinel satellite fleet plays a crucial role. These satellites are designed to collect detailed data on the Earth’s surface, oceans, and atmosphere, providing valuable information for monitoring and managing various environmental and climate-related aspects.
USGS Earth Explorer
The United States Geological Survey maintains the longest continuous Earth observation record through its Landsat program, dating back to 1972. This historical depth makes it invaluable for studying long-term environmental changes. The platform combines the extensive Landsat archive with elevation data and aerial photography, offering a comprehensive view of Earth’s surface changes over time.
EUMETSAT Data Store
The European Organisation for the Exploitation of Meteorological Satellites focuses on weather and climate monitoring through its constellation of satellites. Their data store provides near-real-time access to observations from both geostationary and polar-orbiting satellites, crucial for weather forecasting and climate studies.
Working with Satellite Data
To make the most of satellite data, you need the right tools and knowledge. Understanding the basics of software, storage, and data processing will help you achieve your goals more effectively. Here’s what you need to consider:
- GIS software (QGIS, ArcGIS) or programming libraries (rasterio, earth engine)
- Sufficient storage capacity (individual scenes can be several GB)
- Understanding of coordinate systems and projections
- Knowledge of band combinations for specific analyses
Here are 5 tips recommended by NASA for working with satellite images:
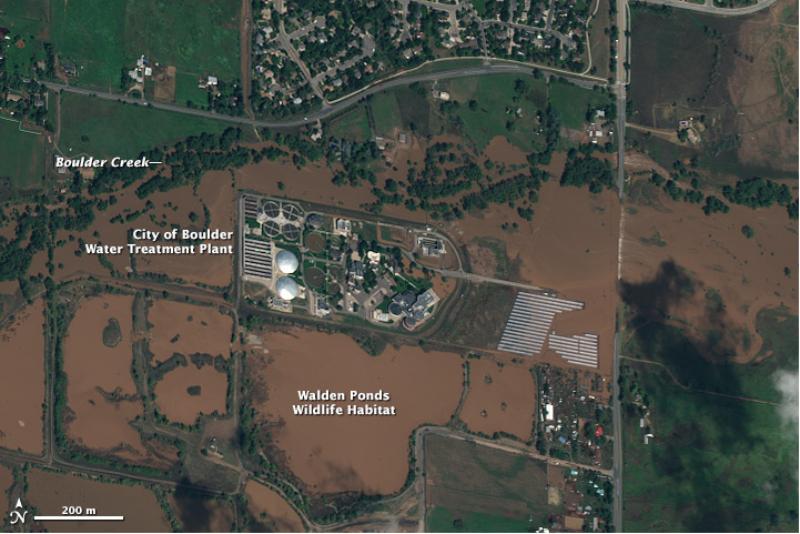
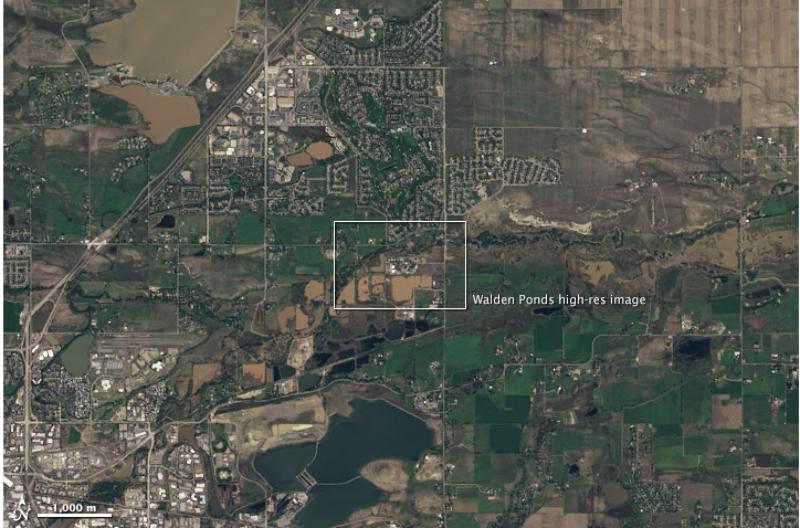
- Look for a Scale: Always check the scale of the image to understand the level of detail. This helps you interpret larger or smaller areas more accurately.
- Look for Patterns, Shapes, and Textures: Identifying patterns and shapes can help you recognize land features, such as roads, bodies of water, crops, or geological formations.
- Define Colors: Understanding the colors in satellite images is essential. Colors are tied to different types of light captured by the satellite and can help identify features like water, vegetation, and land areas.
- Find North: Knowing the orientation of the image is crucial. Always locate north to better understand the positioning of geographical features like mountains, valleys, or cities.
- Consider Your Prior Knowledge: Use what you already know about the area you’re observing. This can help you interpret changes or unusual patterns, such as deforestation or fire damage.
Satellite imagery offers valuable data that can be used to understand local features and changes on the Earth’s surface. By analyzing different spectral bands and utilizing various satellite sources, we can monitor aspects such as vegetation health, urban development, and environmental shifts. This data provides a powerful tool for decision-making and problem-solving at a local level, allowing for more informed and effective management of natural and human-made resources.
Satellite images are just one of many ways to access and analyze valuable data. Want to explore more? Register at Datasketch today!
