Data visualization is a vast and dynamic universe, filled with charts designed for a wide range of needs. Do you often rely on the same types of charts? At Datasketch, we’ve created a guide featuring over 100 different visualization types so you can discover new ways to represent your data.
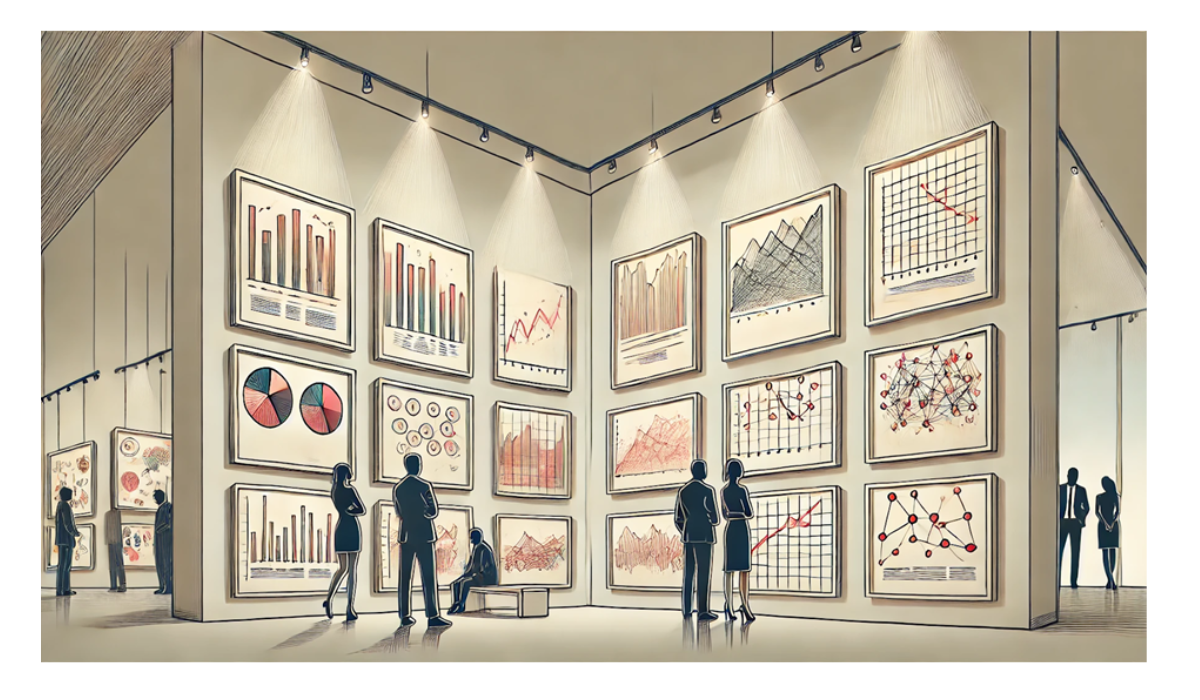
Our Visualization Types Gallery showcases more than 100 different chart formats — from classic bar and line charts to maps, networks, and bubbles. Ever heard of lollipop or polar charts? Now’s the time to explore them.
Each visualization is designed with a specific purpose, and in our gallery, we explain what each one is for. Some charts highlight trends over time, others help you compare categories, identify correlations, or reveal complex structures. Our guide will help you choose the best option based on your goals.
How to Choose the Right Visualization?
Selecting the right chart depends on several factors:
-
The message you want to communicate: Are you showing a comparison, a trend, a distribution, or a relationship?
-
The type of data you have: Categorical, numerical, geographical, or temporal
-
Your audience: Their familiarity with different types of visualizations
-
The context of use: Is it for a presentation, a report, or an interactive dashboard?
Our gallery not only introduces you to different visualization types but also offers guidance on when and how to use them effectively.
Create Your Own Visualization
At Datasketch, we want to help you choose the right visualization for every kind of data. We know that the decision isn’t always obvious — if your data shows changes over time, a line chart may be useful; if you’re working with categories, a pie chart might be a better fit; and if you’re illustrating relationships between elements, a Sankey diagram could be the clearest option.
To make this easier, we developed a Visualization Recommender that analyzes your data and automatically suggests the most suitable chart type.
We’ve preloaded a few datasets so you can try the tool out right away. Create your free account now and start visualizing like a pro.
