Calculator to Measure Social Return on Investment (SROI): The Case of Ohio University

The Voinovich School of Leadership and Public Service at Ohio University is recognized in higher education for its track record in applying the Social Return on Investment (SROI) model. This methodology serves as a tool to quantify and communicate the social value generated by various projects, evaluating not only financial outcomes but also the intangible benefits they provide to communities, such as social well-being and environmental sustainability.
The Challenge
The central question was: How can complex data from multiple social projects be transformed into clear, actionable information that demonstrates true value and contribution to the community? Ohio University faced three fundamental challenges:
- The SROI team needed to optimize the analysis of diverse data sources, including surveys, economic indicators, and program outcomes, converting them into monetary values that could demonstrate the return on investment.
- Manual calculations in spreadsheets were time-consuming and limited the team’s ability to share information effectively.
- The university aimed to revolutionize the way organizations measure and communicate social impact, ensuring that the solution could be implemented by any organization, regardless of its technical expertise.
The Solution
In 2023, Ohio University partnered with Datasketch to develop an innovative platform that automates SROI calculations, creates engaging visualizations for various audiences, provides customizable impact calculators, maintains a comprehensive database of proxy values, and generates dynamic impact reports for the general public.
From Excel Spreadsheets to Interactive Interfaces
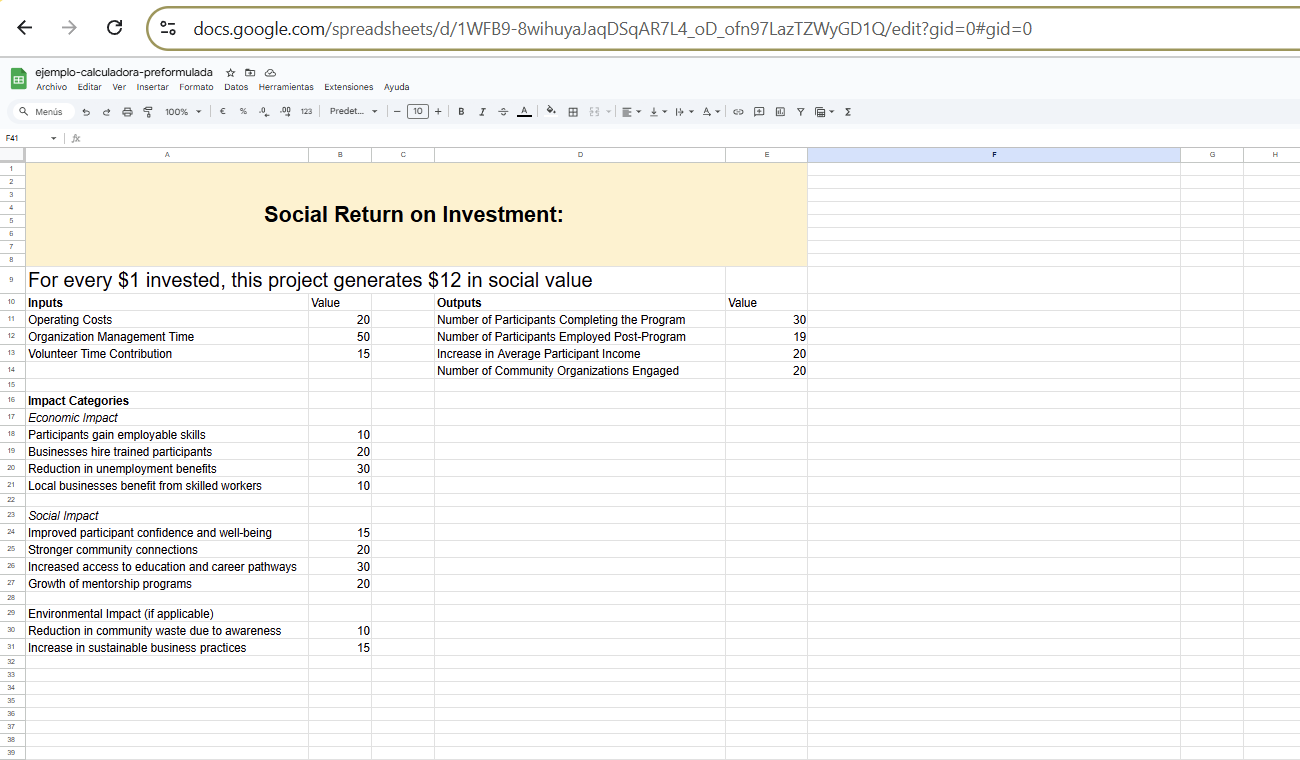
Calculating social return on investment is a complex process, especially when organizations, donors, and communities are expected to measure and understand impact in intangible areas. To achieve this, the SROI team used various spreadsheets with templates and formulas. While these tools were initially helpful, over time they created technical barriers and hindered communication.
Some of the key issues included:
- Organizations, donors, and communities could not access or understand the calculations without specialized assistance.
- The manual process increased the risk of errors, compromising the integrity of the results.
- The resulting reports were static and difficult to update.
Before: Example of a pre-made Excel calculator.

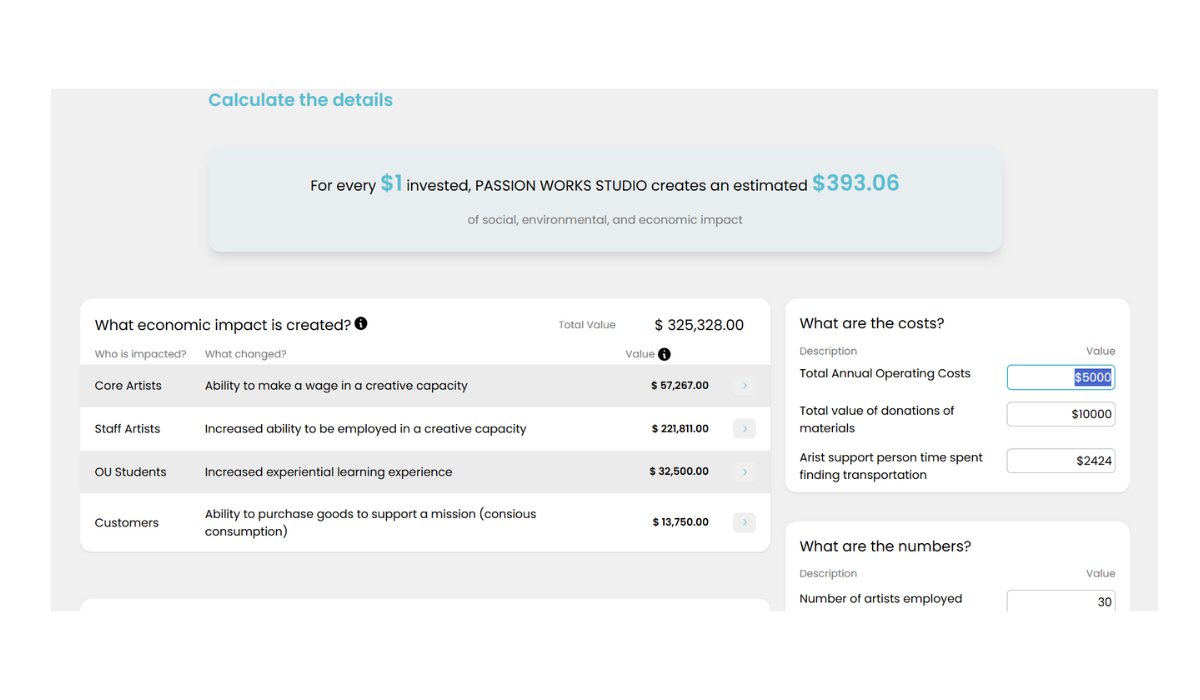
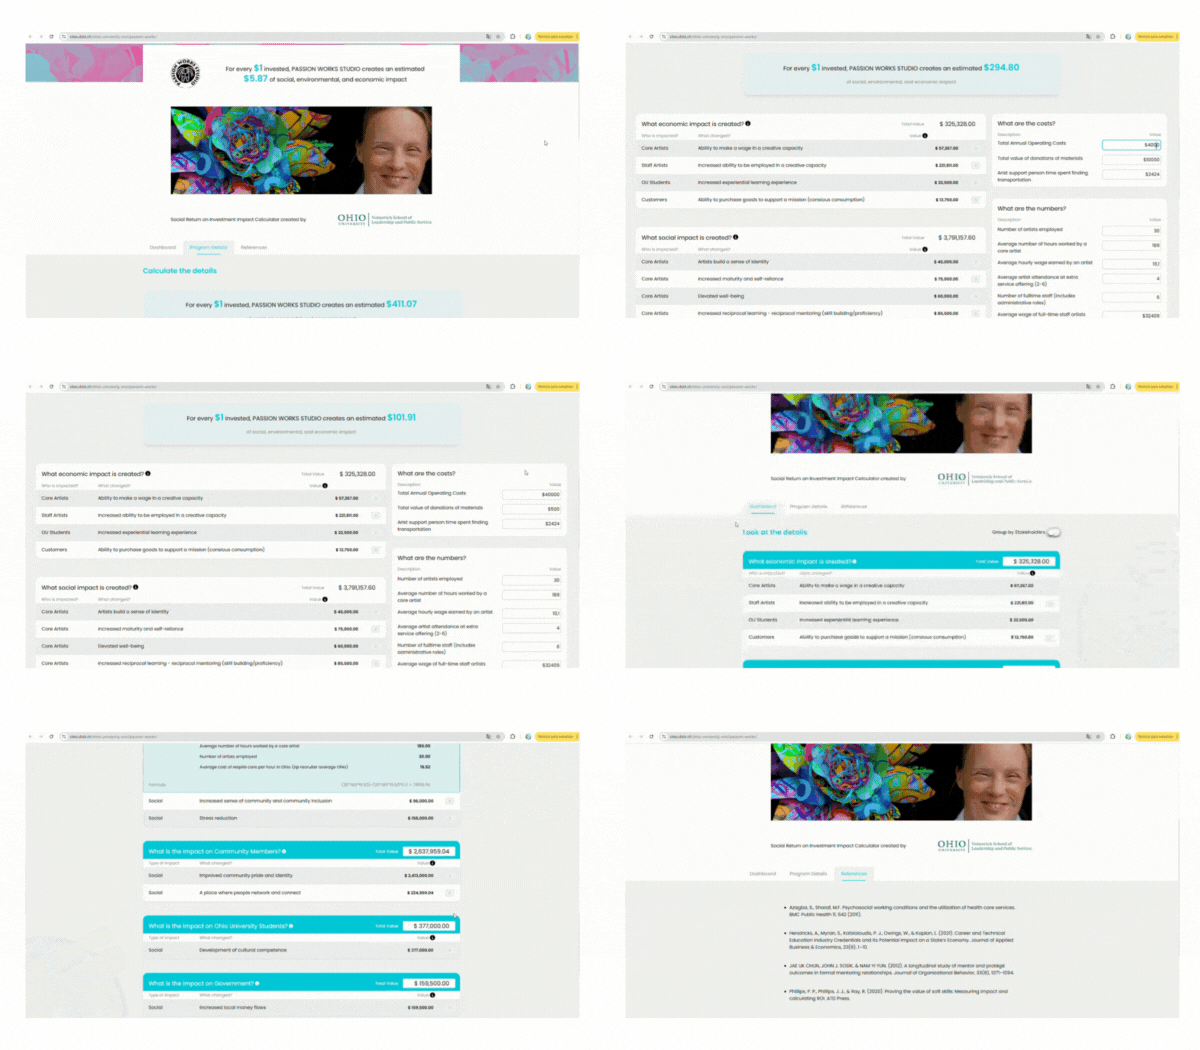
To address these issues, we developed a web-based calculator that allows donors, stakeholders, and the university team to quickly and rigorously calculate the social return on investment. The system allows users to modify input variables and draws from a predefined template that the SROI team defines according to specific outcomes and proxies for each calculation.
The calculator not only simplifies the technical process but also makes it accessible to users without specialized knowledge, democratizing the measurement of social impact and ensuring that organizations of all sizes can effectively demonstrate their value to the communities they serve. Through an intuitive workflow, the tool guides users step-by-step through the measurement process, explaining key concepts and validating entered information in real-time.
Now: Automated calculator in a web interface.

Inefficient Management of Proxy Values
One of the most critical challenges in calculating social return on investment (SROI) was the inefficient management of proxy values, which are the monetary equivalents used to quantify social impacts. The SROI team faced several issues related to these values:
- Fragmented storage: Proxy values from academic literature, previous studies, and various sources were stored without a centralized system, making them difficult to access.
- Difficult access: Searching for specific proxy values required reviewing multiple documents and spreadsheets without an efficient indexing system, slowing down the process.
- Duplication of effort: Research was often conducted to obtain proxy values that already existed but were not properly cataloged or available.
- Lack of standardization: There was no consistent method for documenting the provenance, validity, or applicability of these values.
Solution: Centralized Proxy Value Repository and Its Integration with the SROI Calculator
With the automation of the calculator, a significant advancement was also made in the systematization and integration of proxy values. This change not only improves process efficiency but also facilitates the future implementation of calculations in other projects. Thanks to this solution, Ohio University’s SROI team obtained:
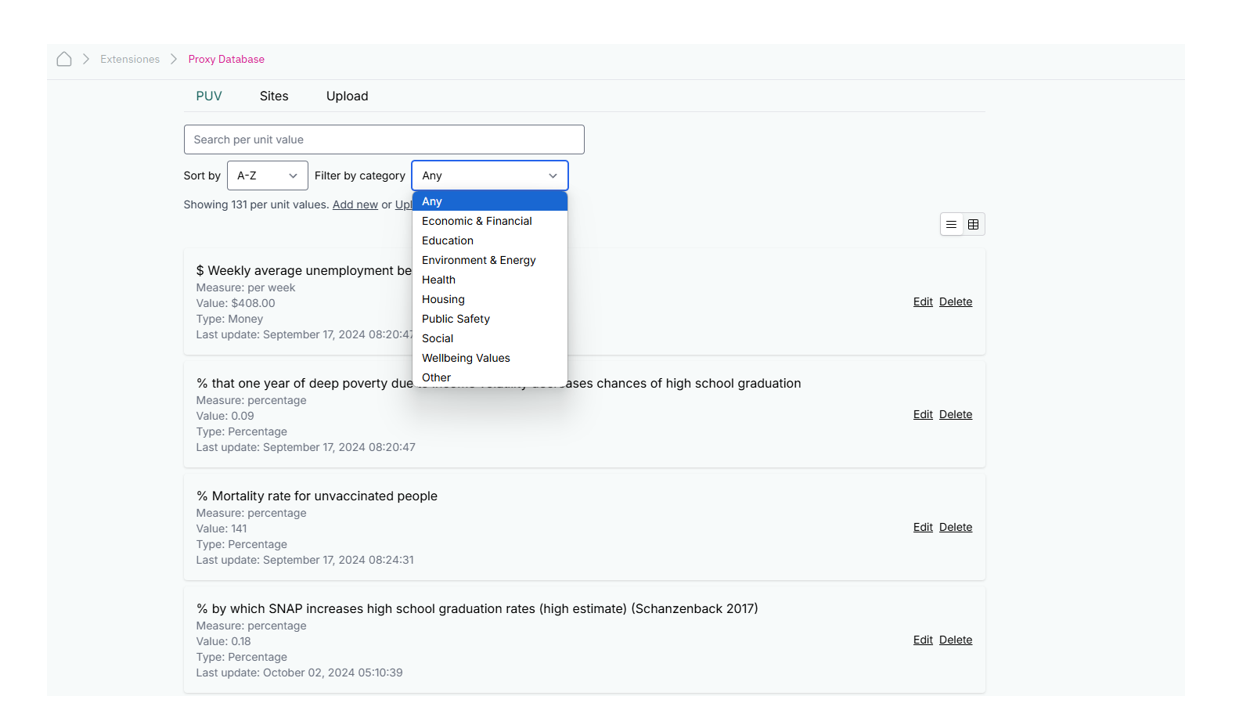
- Structured database: Proxy values are now stored in a centralized repository with complete metadata, facilitating easy search and application.
- Categorization: A tagging and categorization system allows users to filter values by theme or letter, streamlining their use.
- Academic traceability: Each proxy value includes references to its original sources, unifying information that was previously difficult to access.
- Efficient reuse: Users can leverage previously validated proxy values, saving research time and improving consistency across studies.

The Impact
The transformation has had a significant impact on multiple stakeholder groups. For the university, it has enabled faster and more consistent analysis, improved the ability to demonstrate the value of programs, and optimized data management and updates. For social organizations, it has provided access to professional impact measurement tools, improving their ability to communicate value to investors and donors and offering a standardized approach to impact calculation. For researchers, it has facilitated centralized access to standardized proxy values, improving data consistency across studies and increasing the ability to compare programs.
Looking Ahead
This platform represents more than just a technological solution—it’s a transformation in the way organizations measure and communicate the social impact of investment projects. By making sophisticated analysis tools accessible and easy to use, the platform enables organizations to make data-driven decisions that benefit their communities.
Key Learnings
The project demonstrated that complex, multi-variable analysis methods can be democratized. Automating these processes in calculators significantly improves the quality and consistency of social impact reports. Additionally, the ease of data visualization generates greater impact across diverse audiences.
Got questions or want to learn how we can help you implement this solution in your organization? Feel free to contact us