How is 100% of Global CO₂ Emissions Distributed by Country?

At Datasketch, we wondered how the 100% of accumulated carbon dioxide (CO₂) emissions are distributed among the countries of the world. To answer this question, we visualized data from the Global Carbon Budget (GCB), a report that tracks global greenhouse gas emissions.
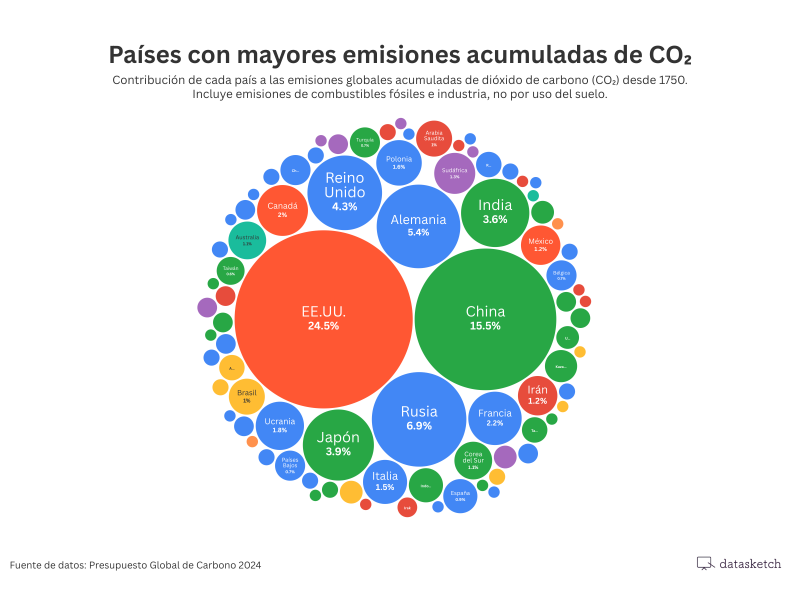
In the following chart, you can see how accumulated CO₂ emissions since 1750 are distributed across different countries.

The United States tops the list with 24.5% of total accumulated emissions, followed by China (15.5%) and Russia (6.9%). Germany and the United Kingdom have contributed 5.4% and 4.3%, respectively. Together, these five countries have been responsible for more than 56% of the CO₂ emitted since the Industrial Revolution.
Other countries like Japan (3.9%), India (3.6%), and France (2.2%) also rank among the largest historical emitters. In contrast, most countries around the world have had a marginal impact on accumulated emissions. Countries like Mexico, Argentina, and Spain each account for just over 1% of global historical emissions.
These data help us understand how a small group of countries has historically generated the largest volume of polluting gases. Just like this article, on our blog you will find other data-driven stories where the number 100 plays a starring role. Follow us on our social media to discover more stories like this one!