Data and Fanzines: Twisting Numbers into Analog Narratives
Fanzines were born as a free, DIY, and creative way to say something. They’re small, self-managed publications made by hand and meant to circulate among friends, neighbors, or communities. They can be photocopied, illustrated, typed, or handwritten. And while it may not seem obvious at first, they can also speak in data.
Yes, you read that right: data. Those figures that often feel cold or abstract can also become personal, powerful stories when paired with the visual spirit of a fanzine.
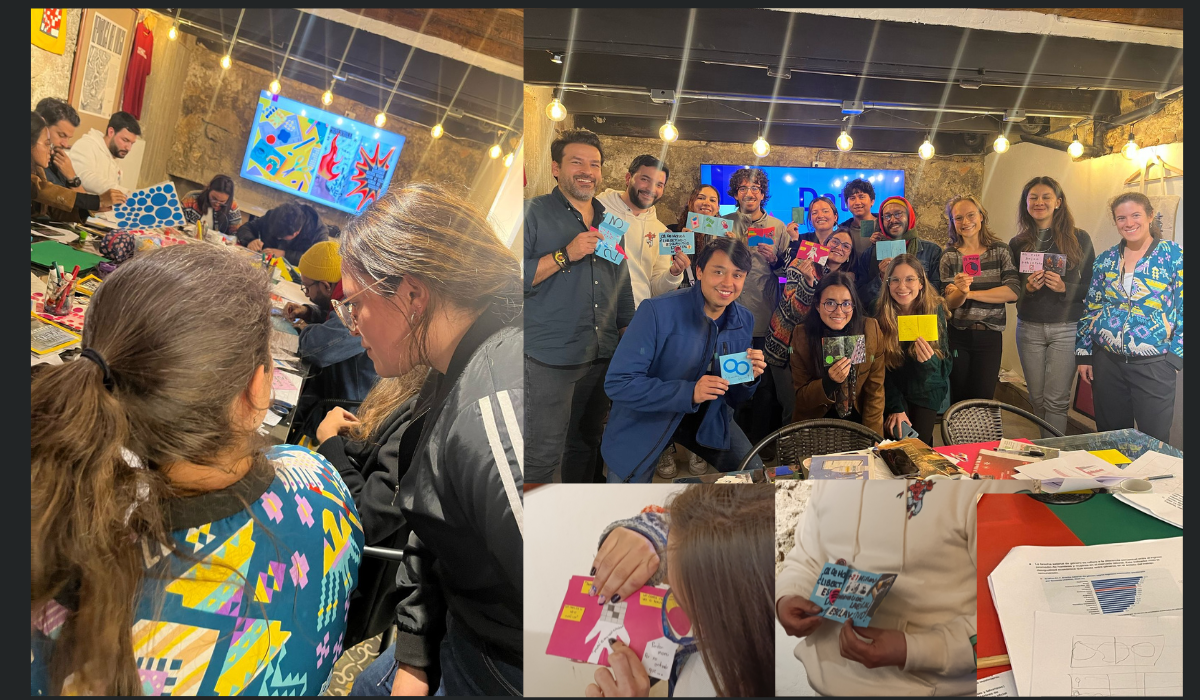
At Datasketch, we love to experiment. That’s why we hosted Datazines, an event within our weekly Data a la Lata series, where we invited people to create fanzines with data related to May 1st—International Workers’ Day. The result? An afternoon full of scissors, markers, and meaningful conversations about labor, workers’ rights, and the numbers behind those stories.
What’s a fanzine?
A fanzine (short for “fan magazine”) is a low-budget, high-creativity publication. It doesn’t follow strict rules: it can be a folded sheet or a few stapled pages, hand-drawn or printed from a computer. The only real requirement is that it has something to say—an opinion, a story, a cause, or a perspective.
And that’s exactly what well-used data can do too: tell stories. That’s what makes this mix so powerful.
How do you make a data-driven fanzine?
You don’t need to be a data journalist or a designer. All you need is something to say and a couple of data points to support it. Here are a few simple steps to help you create your own datazine:
-
Pick a topic that matters to you
It can be something broad like labor precarity, or something very specific—like how many days your health provider takes to give you an appointment.
-
Find one or two data points that help tell the story
You don’t need to fill your zine with charts—just find that one figure that makes you think and sparks a narrative. For example: “In Colombia, 57% of workers are informal.” From there, what do you want to say?
-
Think about how you’ll tell it
Use drawings, short texts, illustrations, or cutouts. You can sketch a chart by hand or use the data as a jumping-off point for a personal story.
-
Make a rough sketch
This part is optional: you can either let your imagination guide you in the moment or plan things out beforehand. If you go with the second option, we recommend making a storyboard. A storyboard is a visual outline that helps you structure your narrative and decide what goes on each page—kind of like sketching a mini comic. It’s a great way to visualize the flow of your fanzine before you start.
-
Cut, glue, draw, fold
Perfection isn’t the goal. The charm of a fanzine lies in its spontaneity. It should feel like it was made by a human—not by a machine.
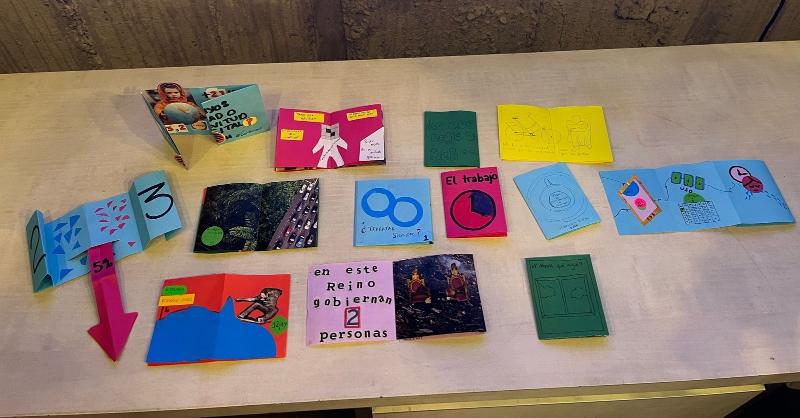
Here are some examples of data-based fanzines created by participants in a workshop we held on this topic.
Check out more details about the event here.
Why bring data and fanzines together?
Because data doesn’t have to live only in spreadsheets or dashboards. It can exist on paper, in colors, in formats made by hand. And because fanzines can take data into spaces where it usually doesn’t go.
At our Datazines event, we talked about youth unemployment, inequality, and unpaid care work at home. What stood out was seeing how a statistic could become a story—and how a chart could spark a conversation. That’s what drives us at Datasketch: making data understandable, relatable, and shareable.
Follow Datasketch Lab on social media to stay in the loop about our next Data a la Lata events. Every Monday is a new chance to gather, create, and talk about tech and data. Hope to see you there!
