What Is a Pictorial Chart and How Can You Use It to Visualize Data?

Pictorial charts are a fun and creative way to represent data using images that are filled in proportionally based on a percentage. Unlike bar or pie charts, which use basic geometric shapes, pictorial charts rely on recognizable illustrations—like a house, a person, or a tree—to make the data easier to interpret at a glance.
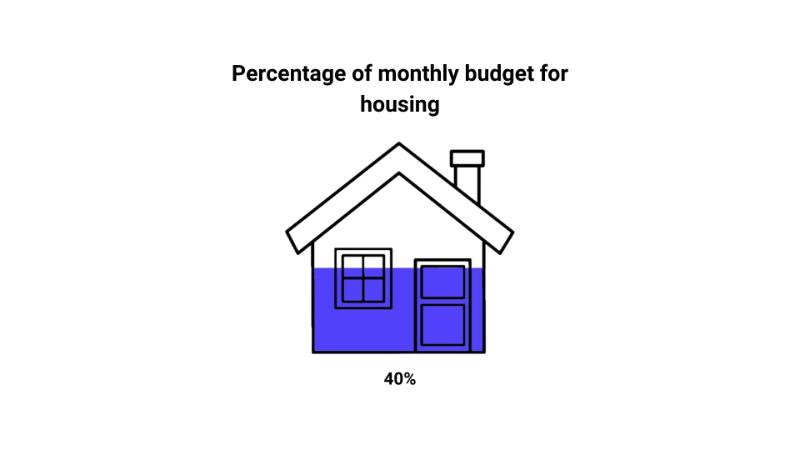
They work like visual gauges. For example, if you want to show that 40% of a person’s monthly budget goes to housing, you can use an image of a house filled in at 40%. This way, the data is quickly understood and immediately associated with the topic it represents.
Beyond their aesthetic value, pictorial charts help make data feel more relatable and easier to grasp. By combining the symbolism of an image with the clarity of a percentage, they communicate information in a clear, compelling, and effective way.
How to Create a Pictorial Chart
It’s simple. First, create an account on Datasketch or log in if you already have one. Once inside, go to the “Extensions” section and select “Pictorial Charts”—or go directly via this link.
From there, you can upload an image that will serve as the visual base for your percentage. Choose an illustration that connects with the topic you want to communicate.
After uploading your image, enter the percentage you want to visualize. For example, if you want to show that 75% of a population has access to a particular service, that percentage of the image will be filled in. You can then customize the fill and background colors. This not only improves the chart’s visual appeal but also helps emphasize contrasts or match your project’s branding.
Once you’re happy with your design, you can download the chart in various formats—ready to use in reports, presentations, or however you want.
This tool is free and easy to use—no advanced technical knowledge required. Visit Datasketch to explore many more tools for working with data: from interactive visualizers to extensions for generating word clouds or extracting color palettes from images. So, what are you waiting for?
