
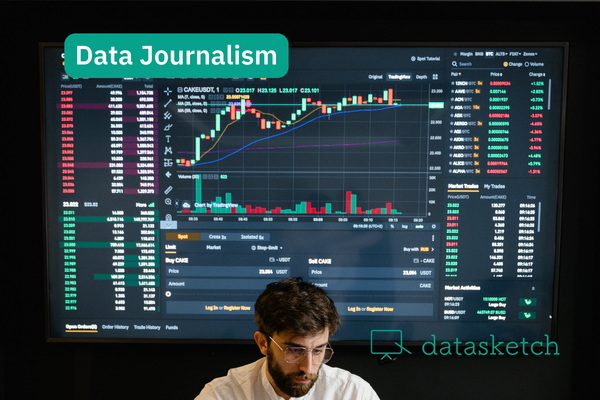
How Artificial Intelligence is transforming journalism
Insights from our Videopodcast on how AI is transforming journalism.
Sep 19, 2025
Stories and insights powered by data analysis
Insights from our Videopodcast on how AI is transforming journalism.
Here’s why using data in journalism is an opportunity to innovate and connect with audiences.
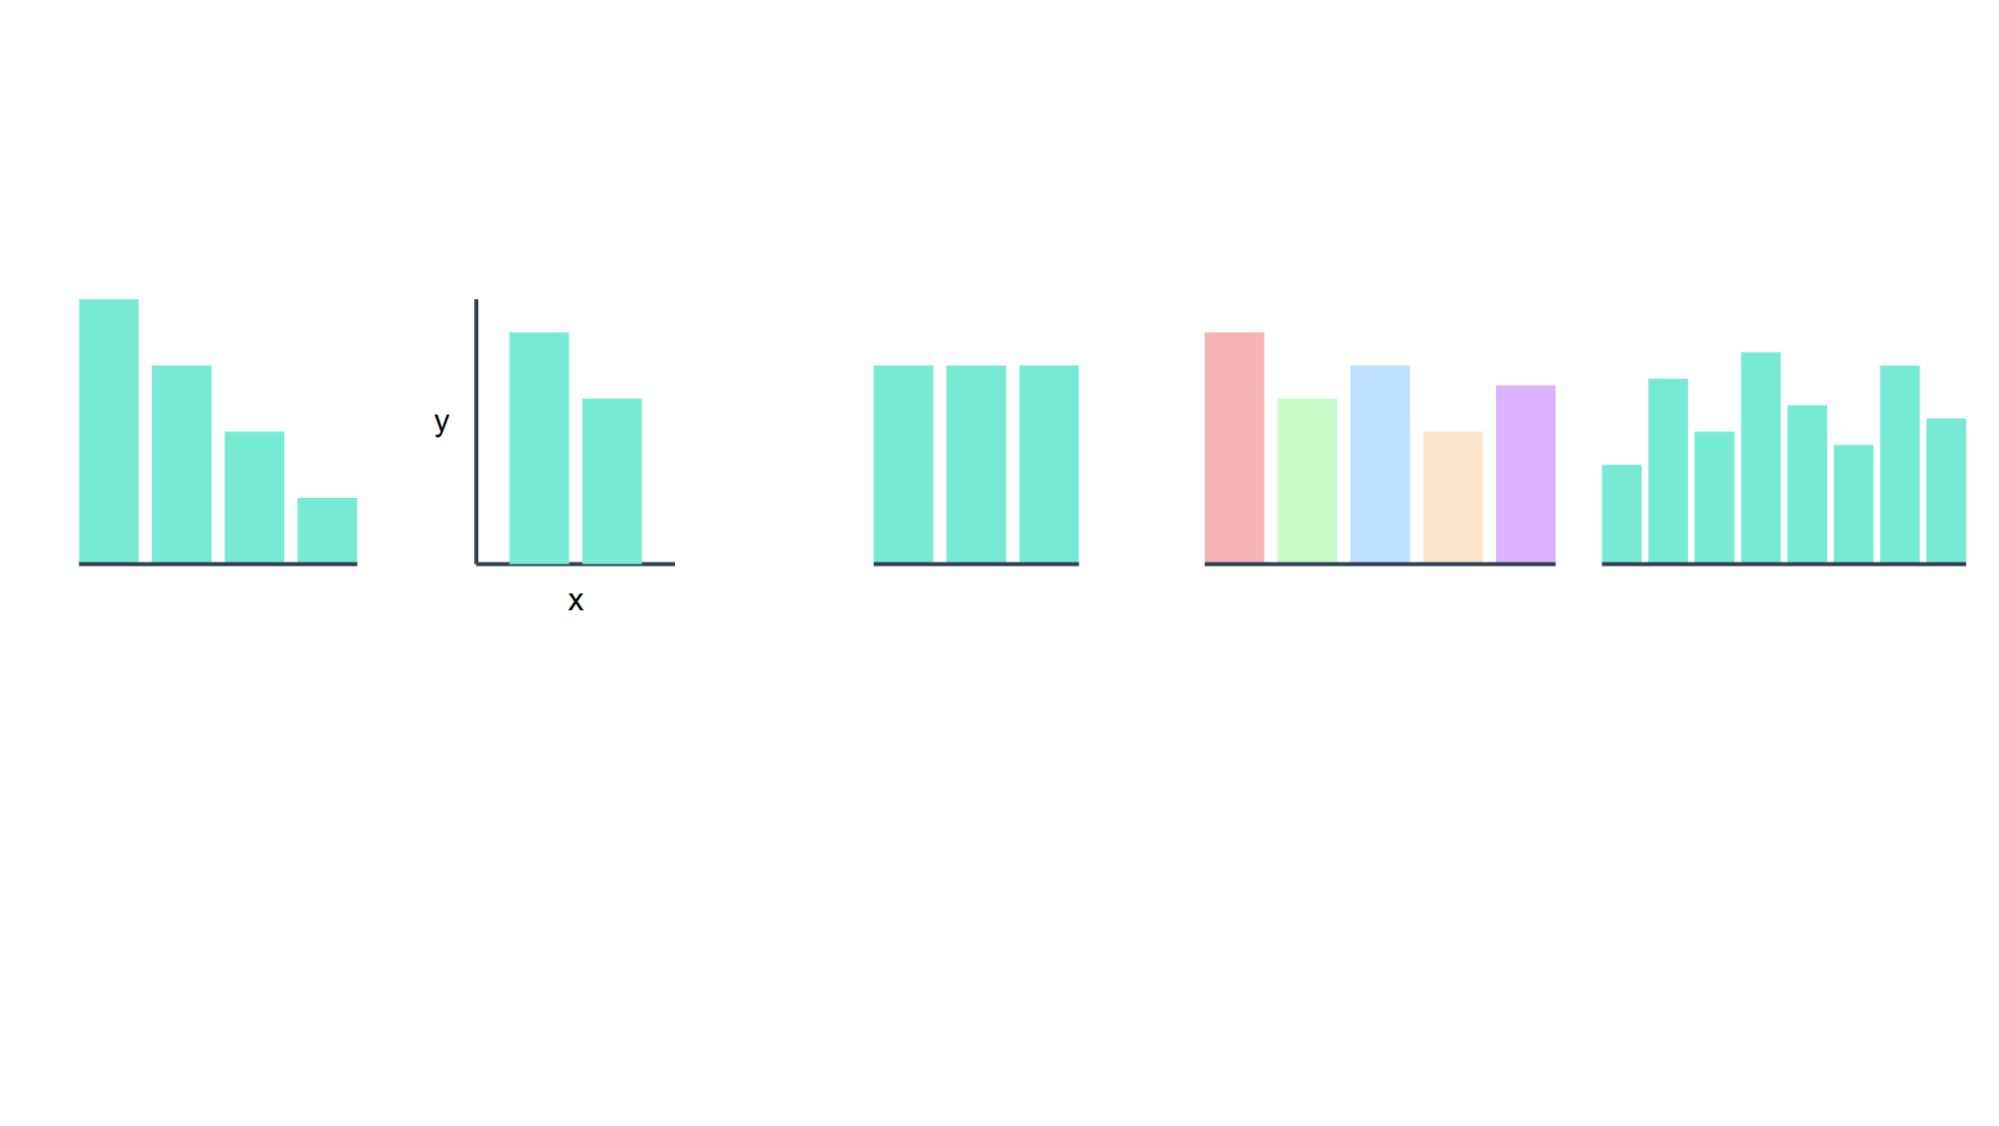
Have you ever created a bar chart, only to find that people struggle to understand it? You might be making one of these common mistakes. At Datasketch, we’ll show you what they are and how to avoid them.

Here we present 5 unconventional data visualizations that inspire us to think about data from different perspectives.

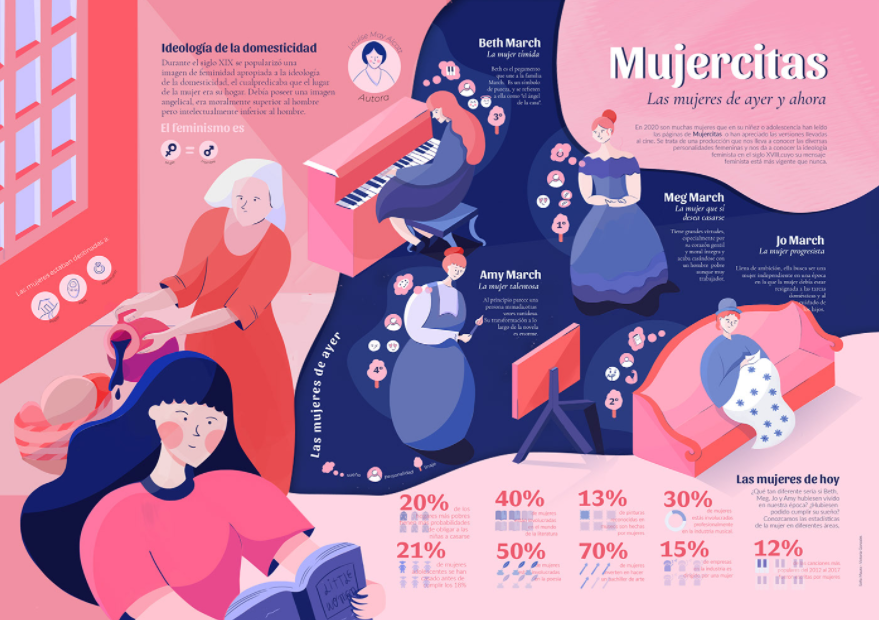
This month, we highlight the connection between data and culture by celebrating two of Colombia’s most iconic literary works. Through our data analysis, we uncover fascinating insights into the search trends surrounding these masterpieces.

Have you ever wanted to create a map but didn’t know where to start? At Datasketch, we’ll walk you through everything you need to dive into the world of data visualizations with maps.
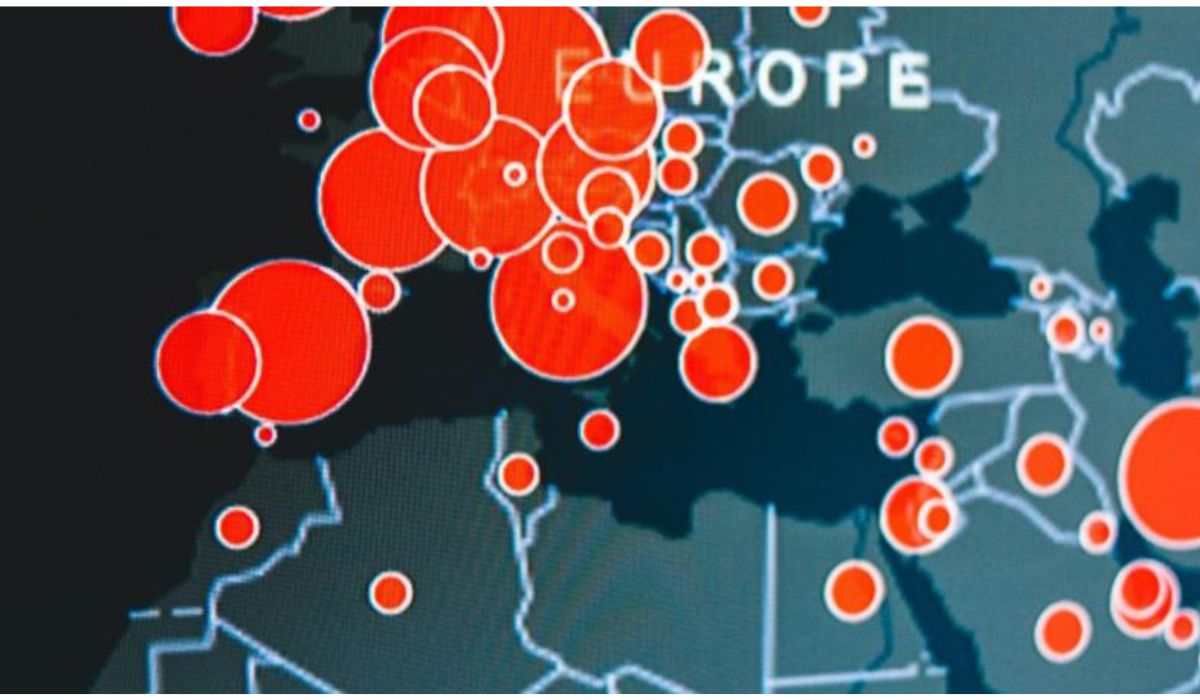
At Datasketch, we explain what a bubble map is and how to use it correctly to visualize your data.
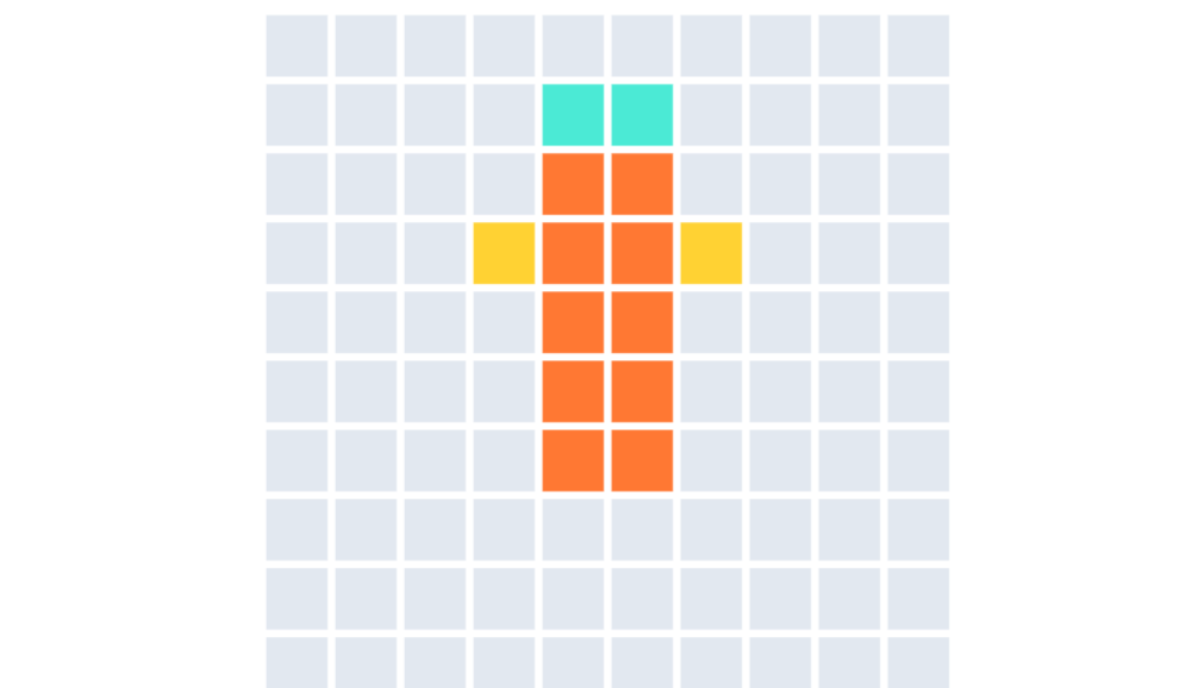
At Datasketch, we explain what a Waffle Chart is and the key points for using it correctly.

At Datasketch, we explain how to transform flat tables into powerful visualizations that make data easier to understand

A responsive graphic not only enhances user experience but also ensures that information is comprehensible in all contexts. Here’s what it’s all about

Choropleths, points, and lines are the most common and effective types of maps for representing geographic data. Here, we explain how and when to use each of them.
Learn how to create clear and effective data visualizations. Discover five key steps to designing graphs that communicate information accurately and attractively

You’ve probably heard of them, seen them, and even created one at some point. In this article, we’ll explain why data visualization is important and how graphs can transform the way we understand information.
Story telling | New Perspectives in Communication | Big Data
The media have focused their attention on the tension between Russia and Ukraine. Their graphics and data journalism teams have brought out their artillery to show what is happening. What do their visualizations consist of?

We tell you what root cause analysis is, how and when you can use it.

"What numbers cannot communicate in a table becomes visible and intelligible when communicated visually. This is the power of data visualization". Aporta Initiative - Government of Spain
We made a selection of the best visualizations of the Tokyo 2020 Olympic Games. Maps, medal tables, multimedia specials, and comparatives.
We explain what an infographic is and how we can communicate data through this graphic tool.

A selection of easy-to-use website-building tools can help you create your website to share your journalistic work and data visualizations.
If you need to create a map, you should check this tools.

How long did it take you to transcribe an interview or audio the last time you worked on one of your projects?

Here are six films that talk about journalism, question it, criticize it and give some food for thought.

All journalists must respond to the 5W, better known as the what, who, where, when, and why. Google Earth helps to answer the 'where.’
